
New Name, New Look, New Challenge!
This year's Challenge uses our digital skills to explore SDG #3, Good Health and Well-being.
New Name, New Look, New Challenge!
This year's Challenge uses our digital skills to explore SDG #3, Good Health and Well-being.
You’ve followed the story of plastic: from its beginning as a product in the store, to its end as waste and pollution. You’ve seen the impact it has on people, animals, and the environment when it isn’t managed properly.
Now you can use data science to help understand where plastic waste is found in your own life. This is the first step towards reducing pollution.
You will put data science into action: collect data about your personal plastic use, organize it, and analyze it to help understand how you can make a difference.
Instructions
If you leave the page, don’t worry! Your data will be saved and you can access it when you come back to the page later.
A bar chart with a single bar, like the one you created above, can provide a lot of information. But bar charts often use more than one bar to compare different categories.
Let's see this in action! Below, compare the amount of plastic you throw away each year to the weight of some Canadian animals to visualize just how much plastic that bar represents.
Click on any of the animals to see the average estimated weight of that animal, plotted alongside the weight of your plastic waste. How many animals-worth of plastic do you throw away a year?


Looking at the bar chart, you can see how even plastic weighing very little can amount to a lot of weight when used consistently over the years.
You’ve completed this step of the challenge - great job!
You’ve reflected on your own plastic use and how it can add up. You can now move on to the Global section to see how the world is coming together to prevent plastic pollution.
Not in a rush and want to take it a step further?
In this extension activity, you will reflect on how plastic waste differs between countries.
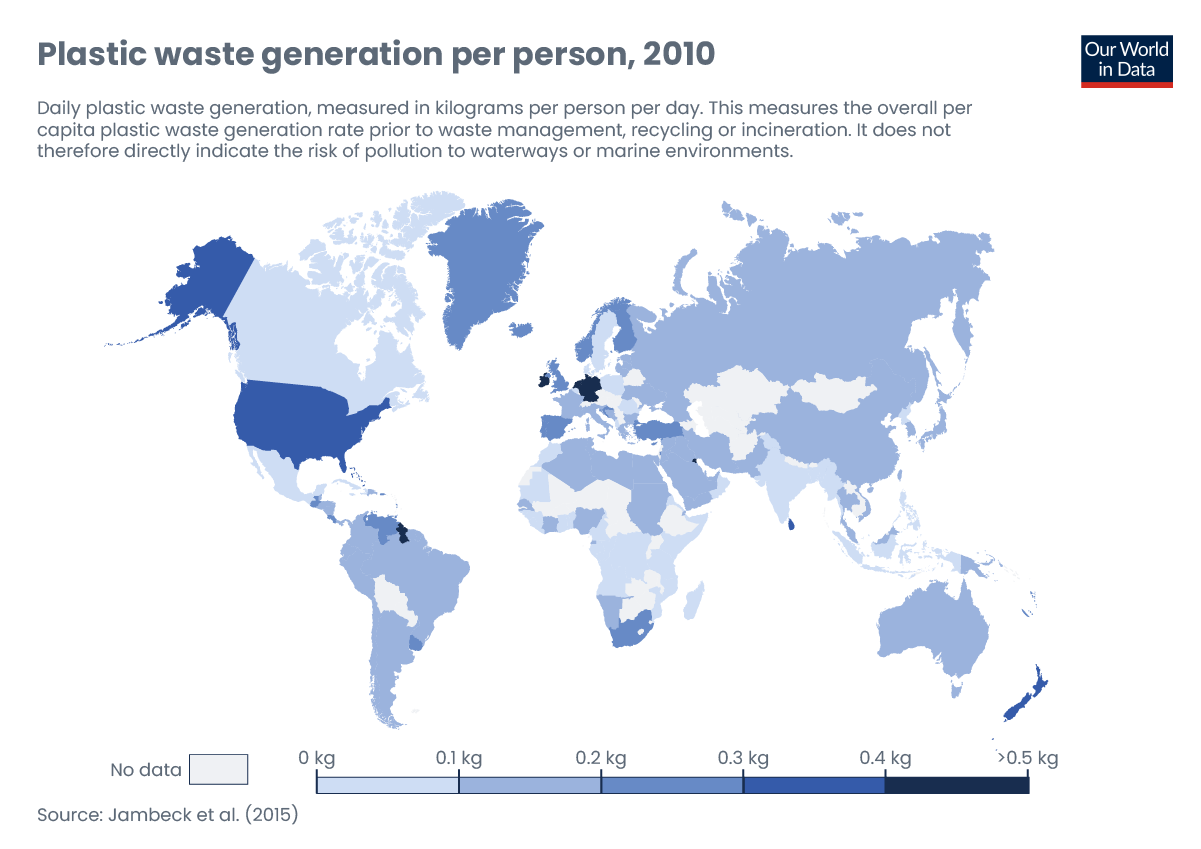 Plastic Pollution by Hannah Ritchie and Max Roser3
Use this infographic to reflect on these questions:
General
Which countries produce the least and the most waste per person? Why do you think countries with no coasts seem to produce much less plastic waste?
Community
Do you think this map reflects the reality of plastic consumption in Canada?
Ethical
Who do you think is responsible for reducing plastic waste: the countries who consume the most, or the countries who produce the most?
Want to dive deeper or just explore the sources?
We provide you with all the page sources and references along with additional related resources in one convenient location.
Due to the interactive nature of the online #kids2030 Challenge platform, it is not supported for mobile. To complete the #kids2030 Challenge, please use a desktop, laptop, or tablet in landscape mode.
Thanks!
